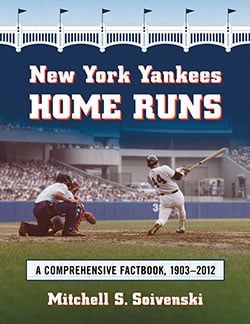
New York Yankees Home Runs
A Comprehensive Factbook, 1903–2012
$49.95
In stock
About the Book
The New York Yankees are synonymous with home runs. With more than 14,000 round-trippers to its credit, New York has out-homered the next most prolific franchise by more than 1,000—despite the Yankees’ having been in existence for 20 fewer years.
This book organizes information on the many New York home runs into detail- and summary-oriented tables. Part I covers various situational categories (e.g., grand-slam, leadoff, walk-off), special dates (Opening Day, Memorial Day, players’ birthdays), and significant player and team records (Gehrig’s 23 career grand-slams, five or more Yankees homers in a game). Parts II and III provide career summaries (number of seasons with 20-plus homers, by position in the batting order) and franchise totals (home runs by ballpark and opponent); and Part IV covers season-by-season totals and yearly leaders. Also included are appendices for inside-the-park and bounce home runs and home runs allowed by the Yankees.
About the Author(s)
Bibliographic Details
Mitchell S. Soivenski
Format: softcover (8.5 x 11)
Pages: 320
Bibliographic Info: appendices, bibliography, index
Copyright Date: 2013
pISBN: 978-0-7864-7124-9
eISBN: 978-1-4766-0096-3
Imprint: McFarland
Table of Contents
Table of Contents
Abbreviations x
Preface 1
Introduction 3
Part I. Home Runs by Detail
A. Categories 5
1. Back-to-Back 5
1a. Most Back-to-Back, Player 19
2. Part of a Cycle 20
3. Grand Slams 20
3a. Most Grand Slams, Player 26
4. Leadoff 27
4a. Most Leadoff, Player 31
5. Multihomer Games 31
5a. Most Multihomer Games, Player 59
6. Pinch-Hit 59
6a. Most Pinch-Hit, Player 63
7. Switch-Hit 64
7a. Most Switch-Hit, Player 65
8. Walk-Off 66
8a. Most Walk-Off, Player 69
9. Extra-Inning 69
9a. Most Extra-Inning, Player 73
10. Leadoff and Walk-Off, Same Game 74
11. Both Games of a Doubleheader 74
11a. Most Times in Both Games of a Doubleheader, Player 79
B. Special Dates 81
12. Opening Day 81
12a. Most Opening Day, Player 82
13. Memorial Day 83
13a. Most Memorial Day, Player 85
14. Independence Day 85
14a. Most Independence Day, Player 87
15. Labor Day 87
15a. Most Labor Day, Player 89
16. Birthdays 89
C. Miscellaneous, Player 91
17. Ruth’s 1927 Season 91
18. Maris’s 1961 Season 92
19. Gehrig’s 23 Career Grand Slams 93
20. Mattingly’s Six 1987 Grand Slams 93
21. Most Against One Team, Season 93
22. Most Consecutive Games Homering 94
23. All Runs on One Home Run 94
24. Milestone Home Runs 95
25. First in Career 97
26. Last in Career 101
27. Youngest to Homer 105
28. Oldest to Homer 106
D. Miscellaneous, Franchise 107
29. Most Against One Team, Season 107
30. Most Consecutive Games, Season 108
31. Most Against a Pitcher, Season 108
32. Five or More, Game 109
33. Eight or More, Doubleheader 116
34. Three or More, Inning 117
35. By Entire Infields or Outfields, Game 121
36. Milestone Home Runs 123
37. Postseason 126
37a. Most Postseason, Player 132
38. All-Star Game 133
39. Baltimore Orioles, 1901–1902 133
39a. Most Against Teams 134
39b. Most Against Pitchers 134
39c. Most by Orioles Players 134
39d. Players Who Homered for the Orioles and Yankees 134
Part II. Player Totals
A. Leaders by Position and Handedness 135
40. By Position and Handedness 135
41. Single-Season by Position and Handedness 138
42. Diagrams: Career and Single-Season Leader by Handedness at Each Position 141
43. By Handedness 145
44. By Batter and Pitcher Handedness 147
45. By Percentage of Home Runs Against Left-Handed Pitchers 149
B. Leaders by Period and Place 152
46. By Percentage of Home Runs at Home (10+ HR) 152
47. By Decade 153
48. By Month 155
48a. Most in a Month, Player and Team 156
49. By Day of the Week 156
50. By Age 157
C. Benchmark Numbers, Season 158
51. Twenty or More 158
52. Number of Times with 10, 20, 30, 40 or 50 159
D. Miscellaneous Leaders Lists 161
53. Position in the Batting Order 161
54. All Home Runs with the Yankees 162
55. Percentage of Career Total with the Yankees 163
56. No Home Runs with the Yankees 166
57. Home Run Percentage 172
58. Franchise Win Percentage When a Specific Player Homers (10+ HR) 176
59. Runs per Home Run (10+ HR) 178
60. Parks, Pitchers and Franchises Homered Against 180
61. In Consecutive Seasons 180
62. Against One Pitcher 183
63. Through Game Number and Month 185
64. Against Boston 186
65. For Both the Yankees and Boston 188
Part III. Franchise Totals
A. Home Runs, 1903–2012 191
66. By Player 191
67. By Ballpark 199
68. By Opposing Franchise 201
69. By Opposing Pitcher 201
70. By Category 216
B. By Ballpark and Opponent 217
71. For All Franchises, All-Time and Since 1903 217
72. Versus Other Franchises 218
73. By Ballpark 224
C. Miscellaneous 235
74. Record in Games with Home Runs 235
75. By Presidential Administration 235
76. Under Each Manager 236
77. By State of Birth 236
78. By Year of Birth 237
79. Line Scores of Walk-Off Games 238
80. Walk-Off Games 249
81. Through Game Number 250
82. Against One Pitcher 251
83. Most and Least by Infields, Outfields and Individual Positions 252
84. When the Yankees Passed Other Franchises 252
85. Best Days of the Year for Home Runs 254
Part IV. Home Runs Year by Year
A. Annual Totals 255
85. Year-by-Year Totals 1 255
86. Year-by-Year Totals 2 257
87. Year-by-Year Totals 3 259
B. Annual Leaders and Miscellaneous 262
88. Team Leaders by Season 262
89. Most Times Leading Team 270
90. First and Last to Homer by Season 271
C. Charts 274
91. Home Runs by Year 274
92. Percentage of Runs on Home Runs 275
93. Home Run Differential 275
94. Home-Away Home Run Differential by Handedness 276
95. Home Run Percentage Versus MLB Average 276
Appendices:
A1. Inside-the-Park 277
A1a. Most Inside-the-Park, Player 283
A2. Bounce Home Runs 283
A3. Non-Home Runs 284
A4. Most Allowed 284
A5. Most Allowed, Postseason 285
A6. Most by Opposing Players 285
A7. Most by Opposing Players, Postseason 285
A8. Total Allowed by Other Franchises 286
Bibliography 287
Index 289
Book Reviews & Awards
“a well-researched and highly informative quick reference source…recommended”—ARBA.


