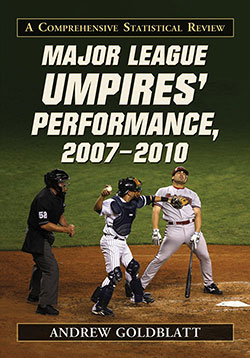
Major League Umpires’ Performance, 2007–2010
A Comprehensive Statistical Review
$39.95
In stock
About the Book
Thirty years into baseball’s sabermetric revolution, relatively little attention has been paid to the impact of a major league umpire’s ball-and-strike judgment on game results. This welcome study corrects this omission by profiling more than ninety current umpires, summarizing their professional history, and charting their performance at home plate from 2007 through 2010. Annual and four-season rankings place the umpires according to four categories: runs per nine innings, walks per nine innings, strikeouts per nine innings, and strikeout-to-walk ratio. The statistical analysis reveals that the home plate umpire’s influence on a game can be huge, both in terms of runs scored and the distribution of walks and strikeouts. By introducing umpires as individuals and encouraging a rational discussion of their work, this examination depicts umpires as dynamic actors whose impact on the game can be measured, analyzed, and enjoyed.
About the Author(s)
Bibliographic Details
Andrew Goldblatt
Format: softcover (7 x 10)
Pages: 206
Bibliographic Info: charts, appendices, bibliographies, index
Copyright Date: 2011
pISBN: 978-0-7864-6058-8
eISBN: 978-0-7864-8687-8
Imprint: McFarland
Table of Contents
Preface 1
Introduction 5
The Umpires 19
Appendices
1. Highest and Lowest Runs per Nine Innings (R/9), 2007 183
2. Highest and Lowest Runs per Nine Innings (R/9), 2008 183
3. Highest and Lowest Runs per Nine Innings (R/9), 2009 183
4. Highest and Lowest Runs per Nine Innings (R/9), 2010 184
5. Highest and Lowest Walks per Nine Innings (BB/9), 2007 184
6. Highest and Lowest Walks per Nine Innings (BB/9), 2008 184
7. Highest and Lowest Walks per Nine Innings (BB/9), 2009 185
8. Highest and Lowest Walks per Nine Innings (BB/9), 2010 185
9. Highest and Lowest Strikeouts per Nine Innings (K/9), 2007 186
10. Highest and Lowest Strikeouts per Nine Innings (K/9), 2008 186
11. Highest and Lowest Strikeouts per Nine Innings (K/9), 2009 186
12. Highest and Lowest Strikeouts per Nine Innings (K/9), 2010 187
13. Highest and Lowest Strikeout-to-Walk Ratio (K/BB), 2007 187
14. Highest and Lowest Strikeout-to-Walk Ratio (K/BB), 2008 187
15. Highest and Lowest Strikeout-to-Walk Ratio (K/BB), 2009 188
16. Highest and Lowest Strikeout-to-Walk Ratio (K/BB), 2010 188
17. Runs per Nine Innings (R/9), 2007–2010 188
18. Walks per Nine Innings (BB/9), 2007–2010 189
19. Strikeouts per Nine Innings (K/9), 2007–2010 190
20. Strikeout-to-Walk Ratio (K/BB), 2007–2010 191
Index 193
Book Reviews & Awards
“Bevis takes the reader on a nostalgic journey and provides a reminder of what the paying customer has lost. A most enlightening and welcome work”—Spitball.